Are We Nearing A Top in the S&P 500?
I’m passing along an article from the Options Trading Signals guys responding to this very question. The OTS team has done a remarkable job in calling the market’s recent upward momentum so I’m paying close attention to the key points they make and implementing some of their ideas in my weekly options trading activities. Highlighted below is the beginning of the article, click the link below the text to read the article in its entirety:
The S&P 500 is Getting Close to a Top
The past few months have been very difficult to navigate for retail investors and institutional money managers. The huge week to week price swings and increased volatility have made the current market conditions exceptionally difficult to maneuver. Day traders are about the only group of market participants that outperform during periods such as we have seen since the beginning of August.
Before I jump into the analysis, I would like to point out to readers that the S&P 500 Index (SPX) has rallied from 1,075 on October 4th to 1224.50 on October 14th. The S&P 500 has rallied almost 150 handles or 14% from the lows to Friday’s close in 10 calendar days. As an options trader and a market participant, I trade the market that I see, not the market that I want. With that said, ask yourself this question: Does a healthy financial construct rally 14% in 10 calendar days?
To put the recent price action into perspective, since the beginning of the year 2000 the S&P 500 would have had a poor track record on an annualized basis when compared to the past 10 calendar days’ trough to peak performance. Only in the years 2003, 2006, 2009, & 2010 would an investor have been able to best the previous 10 calendar days’ performance (Performance data courtesy of Wikipedia). The most amazing thing about the recent price action is that the S&P 500 Index is still underwater for the year even after rallying roughly 14%.
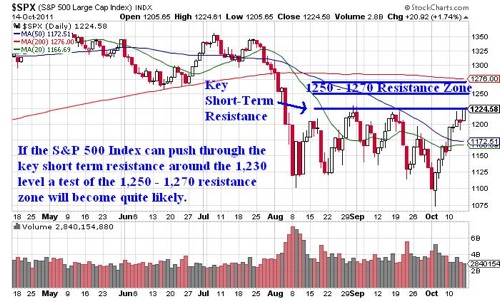
At this point two scenarios are likely to play out. One scenario involves a rally on the S&P 500 towards the key 1,250 – 1,270 resistance zone which is outlined on the chart below. The recent price action in the S&P 500 has been volatile and at this point it has gone nearly parabolic. The daily chart of the S&P 500 Index is shown below:
The resistance level shown in the chart above outlines the key 1,250 – 1,270 resistance zone that will be tested if the S&P 500 can breakout above the 1,230 resistance level. However, it is critical for traders to recognize that probabilities are starting to favor the short side. Let me explain.
If the S&P 500 is able to rally into the 1,250 – 1,270 level it would represent a gain of less than 4%. The bears will vigorously defend the S&P 1,250 – 1,270 resistance zone and it is unlikely that price action will be able to take out that resistance zone on the first breakout attempt.
With only 4% upside, the odds of some sort of correction are favorable at this point in time. Whether the correction begins early next week or whether we have to wait until the key resistance zone is tested, sellers will step back into the driver’s seat in the not-so-distant future.
Click Here To Continue Reading
Similar Posts:
- The Weekly Options Report: Here Comes The Pain
- Gold A Safe Haven No More? – GLD Options Trading Strategy
- TLT Weekly Options Could Be The Call Here
Mr. Saunders serves as Mesa’s Vice President of Marketing, bringing with him a wealth of experience in strategic marketing and operations. In this role, Mr. Saunders is responsible for overseeing all marketing activities, utilizing a blend of traditional and digital strategies to enhance brand presence and profitability, managing a multi-million dollar marketing budget across various media platforms, and leading the continued implementation of CRM systems to streamline customer engagement and drive business growth.

